During the HErZ 2024 Summer School, participants will work in groups of 2–5 people on a distinct research project.
Group Fluxes: Eddy Covariance Measurements
| While quantification of carbon fluxes at global scale is important (e.g. mitigation strategies), most carbon flux measurements are only available at specific sites. Different types of measurement approaches to determine the carbon dioxide (CO2) and water vapor (H2O) fluxes exist. In this project we will derive and compare the fluxes from two in-situ approaches: The eddy covariance method and the flux-gradient method. For this, this group will work with data from an eddy covariance set up on the measurements tower in Jülich as well as concentration profiles from the UAS. |
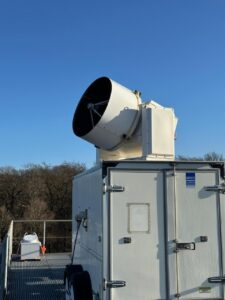
Group Aerosol: How much “dirt” is in the atmosphere?
| Aerosol observations are often confined to near-surface, are however necessary ingredients for cloud formation. New drone technology makes it possible to sense the mass concentration of aerosols within the atmospheric boundary layer, where most of live. The participants will take these observations and compare them to fixed observations at 120m above the surface (meteorological tower). Are drone observations reliable? How does the aerosol concentration change above this height (up to 2km) during the course of the day? Can you relate this to the mixing within the boundary layer? Or rather to the synoptic forcing? This group will work with UAS particle measurement data, LIDAR and Ceilometer data. |
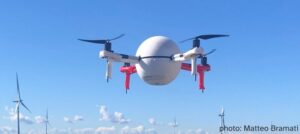
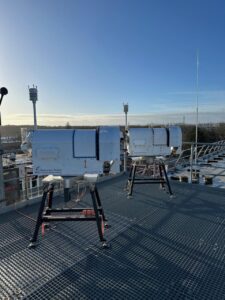
Group UAS: Profiling with Uncrewed Aircraft Systems
| One of the goals of HErZ HIRES-APP is to assess the suitability of UAS (Uncrewed Aircraft Systems) / multicopters for operational vertical profiling of the atmosphere. This group will perform regular UAS flights and compare the UAS-derived wind vector as well as measured temperature, humidity and particles to tower and LIDAR, HATPRO and other profiling devices.
|
 |
Group Clouds: How much water is in the cloud?
| Identify cumulus clouds over the Research Center and document them with your camera. Find them in ceilometer, cloud radar and microwave radiometer observation data. Coimbine with below-cloud wind observations from Doppler lidar to estimate their dimension. Finally: calculate the amount of water in the cloud (tons!?) “floating” above you. Can you characterize cloud development over the time of day? |
 |
 |
Group Precipitation: How variable is local rainfall?
| Using disdrometer (drop size) measurements of precipitation on a 120m tower and on the ground the vertical distribution of precipitation will be measured and analyzed. What is influencing the drop size distributions? How does the horizontal difference look? Do radars radars tells the same story? |
 |
Group Water Vapor: What about the invisible water in the atmosphere?
| Water vapor is an important component of the hydrological cycle: no water vapor means no clouds means no rain. But how can we measure how much is in the atmosphere? The group will use novel sensor technology (lidar, microwave radiometer, drones, radiosonde) to find out how much water vapor is where and how it varies during the course of the day. Which instrument shows the best performance? |
|
Group Model Evaluation: How well does ICON predict vertical profiles over JOYCE during VITAL?
| Does the model have a clue of what’s going on over Jülich? Over the ABC/J (Aachen-Bonn-Cologne-Jülich) area we run a numerical weather prediction model with very high grid spacing (~100m) that considers turbulence, cloud formation, topography and surface interaction in a more sophisticated way than the model of the German Weather Service. Compared to the VITAL I observations: Can this model capture the diurnal variability of of temperature, winds, water vapor, clouds aerosols and precipitation in an adequate way? How sensitive are clouds to the assumed aerosol (CCN) concentration? |
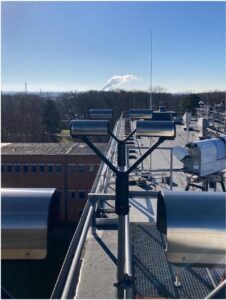
Group Satellites: How do satellites compare with ground-based remote sensing?
| Temperature and humidity profiles determine the atmospheric stability and development of convection. The distribution of temperature and humidity can be measured from satellite and ground-based remote sensing sensors. What are the strengths and limitations of both approaches? The groups will compare atmospheric profiles obtained from MetOp-IASI and ground base remote sensing sensors (MWR, LIDAR) and evaluate them against in-situ radiosonde observations. |
Group Aerosols from pit mines: Can we measure aerosol emissions from a pit mine with ceilometers?
| This project aims to detect aerosols emitted from the Inden pit mine using ceilometers and investigate their impact on nearby atmospheric structures, such as the boundary layer height. The findings will contribute to understanding air quality dynamics and environmental implications in the region. |
 |
![]()
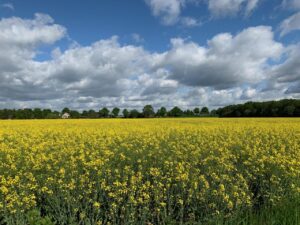
Group Land use change: How does land use change effect CO2 fluxes?
| We would like to investigate CO2 fluxes and concentrations for areas with different land use under the influence of other meteorological parameters. In particular, we want to determine the differences between forest (Jülich Research Centre), agricultural land (Selhausen) and the open pit mines in the area of Jülich |
 |
Group Surface temperatures: Are surface temperatures influenced by open pit mines?
| We want to investigate the impact of the local open pit mines on the local temperature. Therefore we will set up temperature, wind speed and wind direction measuring stations around the pit mine and at Jülich Forschungszentrum. How large will be the temperature differences? Will we detect a diurnal cycle? |

© Raimond Spekking / CC BY-SA 4.0 (via Wikimedia Commons)
(Weblink: https://commons.wikimedia.org/wiki/File:Tagebau_Inden,_gesehen_von_der_Goltsteinkuppe-0178.jpg)
|
Group Cold pool edges: How high do cold pools reach?
| We want to make use of the comprehensive VITAL remote sensing suite to characterize the vertical structures of cold pool edges. The strong near-surface gradients are well known and everyone has already experienced the strong gust fronts at ground level. We will now explore this edge high above our heads up to a couple of kilometers. |
 |
![]()
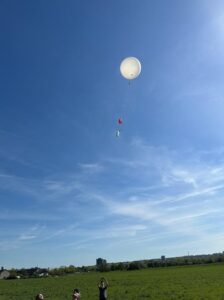
Synoptics: Radiosondes and Synoptic Overview
| Together, all participants will contribute to daily briefings, reports and radiosonde launches.
Can the drones fly tomorrow? Weather forecasting, recording and documentation is an essential part of any meteorological measurement campaign. Participants will prepare daily weather forecasts and present these during the campaign briefing. In addition, regular radiosonde ascents need to be organized and carried out corresponding to the campaign needs. Participants are responsible for a short documentation of day to day weather situation, which is essential for the further analysis of the campaign data. |
 |